
24th-27th of February 2026
Come and be part of Linlithgow’s first Science Fair.
Are you a school kid and have a question you’ve always wanted to test?
Biology, Chemistry, Physics, Engineering, Statistics, Robotics, Space, Environmental?
What to Expect
Student’s Experiments on display from schools all around Linlithgow
VR laboratory experience- get to do science without any experience without the danger of blowing anything up!
Ozo bots to program and play with
Robot demonstration from the Edinburgh Robotarium
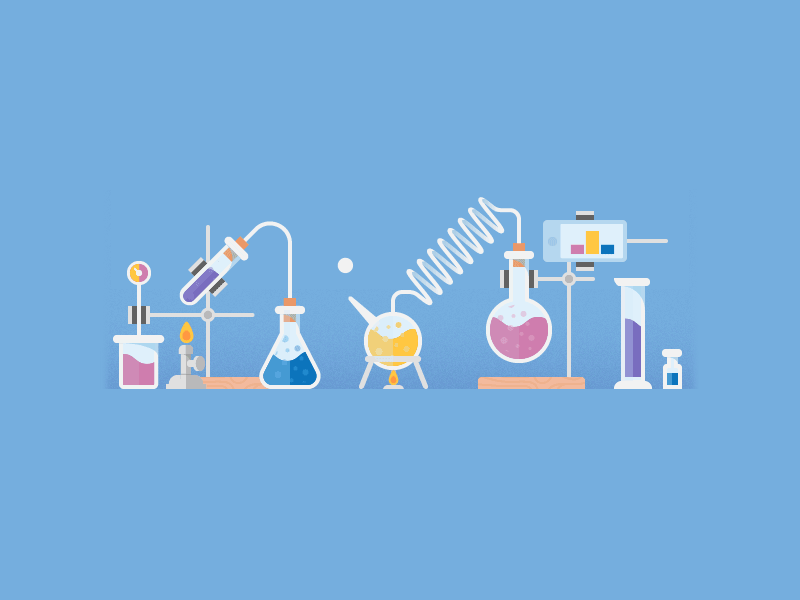
Hands on chemistry experiments and demonstrations
Electronics demonstrations and kit to play with
❋Interactive Science
❋Fun
❋demonstrations
❋Displays
❋Achievement
❋Excitement and Inspiration
❋Career advice - where can STEM take you?
Program 24th of February and 25th of FebruaryThe Low Port Centre, EH49 7HZ
Main Auditorium. Open from 8am.
P4-P7 Students from Linlithgow schools
Students who have registered to do a science experiment and present it, will need to come in the morning to set it up on the display tables. When they come in to visit with their schools at the chosen times, they will be asked to give a short presentation of their experiment and findings to a small group of judges.
The rest of their school visit time, they can watch the demonstrations and enjoy the other kid’s work.
At the end of the two days (>3:30pm on the 25th) we would ask that the students come and pick up their presentations and take them back home- we’re sure you’d like to hang onto them and admire them some more!
The judges will convene after the 2 days of Science Fair and the winners will be announced and given their prizes at their school assemblies in the following weeks.
Program 26th and 27th of FebruaryLinlithgow Academy EH49 6EH
Main Hall, next to reception
S1- S7 Students from Linlithgow Academy
Students who have registered to do a science experiment and present it, will need to come in the morning to set it up on the display tables. When they come in to visit at the chosen times, they will be asked to give a short presentation of their experiment and findings to a small group of judges.
The rest of their school visit time, they can watch the demonstrations and enjoy the other pupil’s work.
At the end of the 1.5 days (>12:30pm on the 27th) we would ask that the students come and pick up their presentations and take them back home- we’re sure you’d like to hang onto them and admire them some more!
The judges will convene after the 2 days of Science Fair and the winners will be announced and given their prizes at their school assemblies in the following weeks.
Video Credit: https://www.youtube.com/@NileRed/shorts the Belousov–Zhabotinsky reaction
“The only difference between messing about and Science is writing it down”
Adam Savage from the Myth Busters (PG version)
What is a hypothesis?
You might have a question that you’re interested in- but you need to form that into something you can test- that is a hypothesis and a prediction
For example a question might be: “I wonder how many birds visit my backyard?”
Your prediction might then be “many birds of different species visit my back yard at different times”
Your Hypothesis might then be: “Birds of different Species and number visit my backyard over a week”
Or your question might be “I wonder if I can make a new type of propeller that moves air more effectively that the ones used today in aviation?”
Your Hypothesis might then be: “The shape and angle of 2 spanned propellers affects the volume of air moved at 200rpm”
Collecting Data
Collecting data can come in many different forms:
Photos
Counting certain kinds of a thing (type of bug, number of cars, how many broken eggs in a new kind of egg container)
Measuring (volume of water lost, length of flight, volume of air per second)
The important thing is to remember to write it down, with all of the “meta data”
What is Meta Data?
Meta data is the information about the data you collected like when and where and how you collected your data- it helps people understand your collected data better- as they can place it and understand how it was collected- and what it might mean.
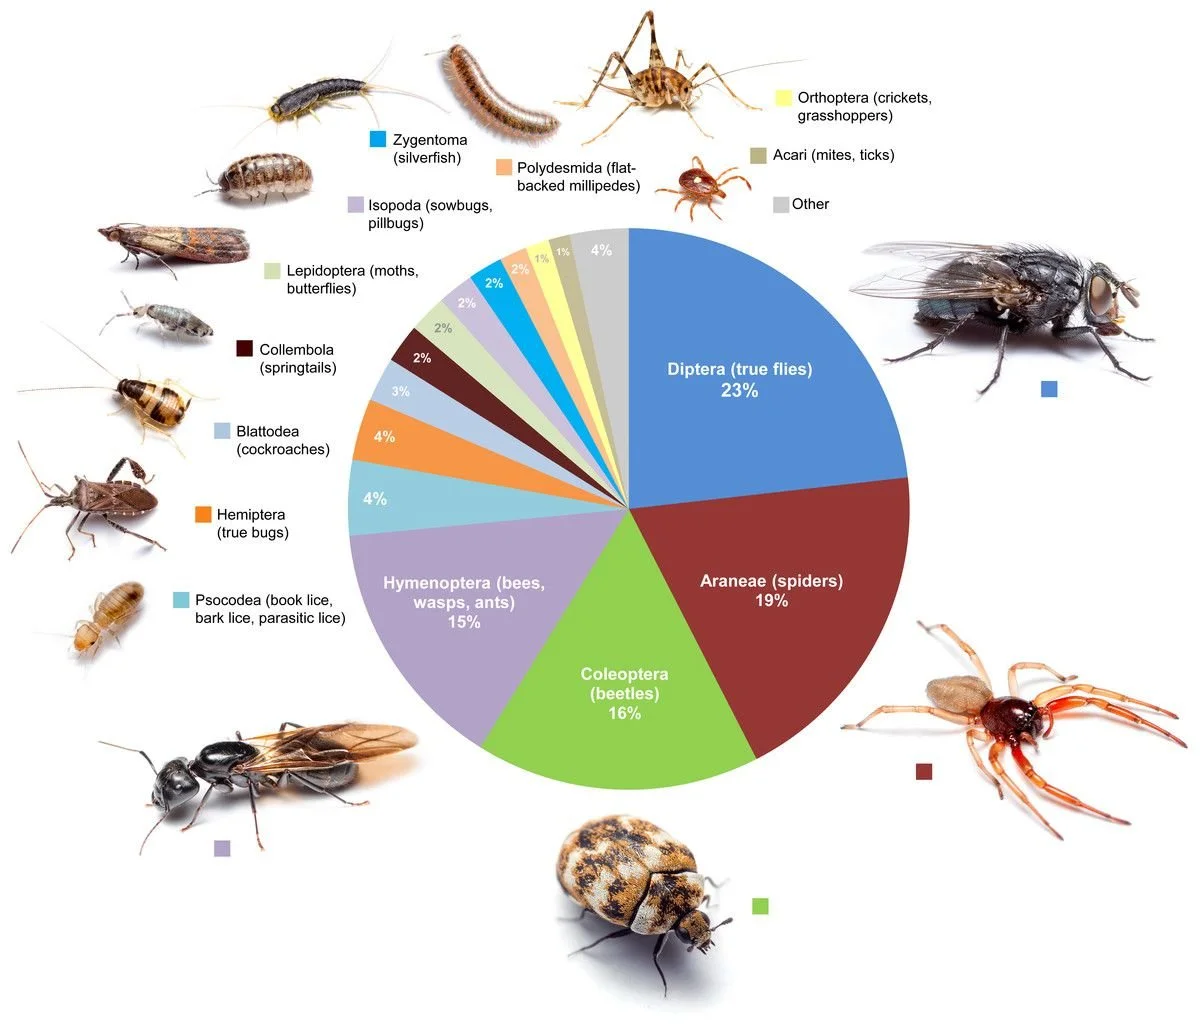
This graph shows you how many of each insect- with the meta data of in your home, and each species as a percentage
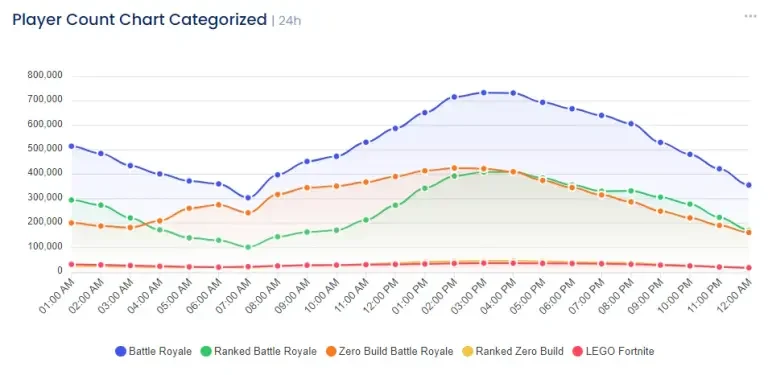
This Graph shows you how many players play what kind of Fortnite game - but over time- so you have time information - or temporal information- it tells you more about how the game is being played, not just how many people playing
Conclusions
What does your data tell you? You had your question at the beginning of your experiment- does you data answer that question? Does it prove your hypothesis right or wrong?
Remember - negative results are results too- if your experiment didn’t answer the question- one of your conclusions could be that you need to redesign your experiment! Remember to explain your statements and back them up with why you are saying it worked or didn’t.
Some examples:
Hypothesis: A long thin paper plane design will fly further than wide paper plane designs.
Conclusion: On testing out 6 different paper plane designs and taking an average of 5 flights per plane, we found that planes with a wing span of 10cm fly the furthest (3.2m). We additionally found that using shiny paper increased the flight length by an average of 0.5m. We think this might be due to reduction in drag.
Hypothesis: The most popular lunch food eaten by the children in my class is crisps.
Conclusion: After collecting the lunch food data from my class mates for 2 weeks, I found that apples are in fact the most popular food eaten by my class mates, by (50% of the class). The second most popular food was chocolate biscuits (25% of the class), and crisps came in third with (15%). Therefore my hypothesis was proven incorrect.
What is a Method?
A method is just the recipe (just like in a cooking book) to tell people how you did your experiment. Here is an example:
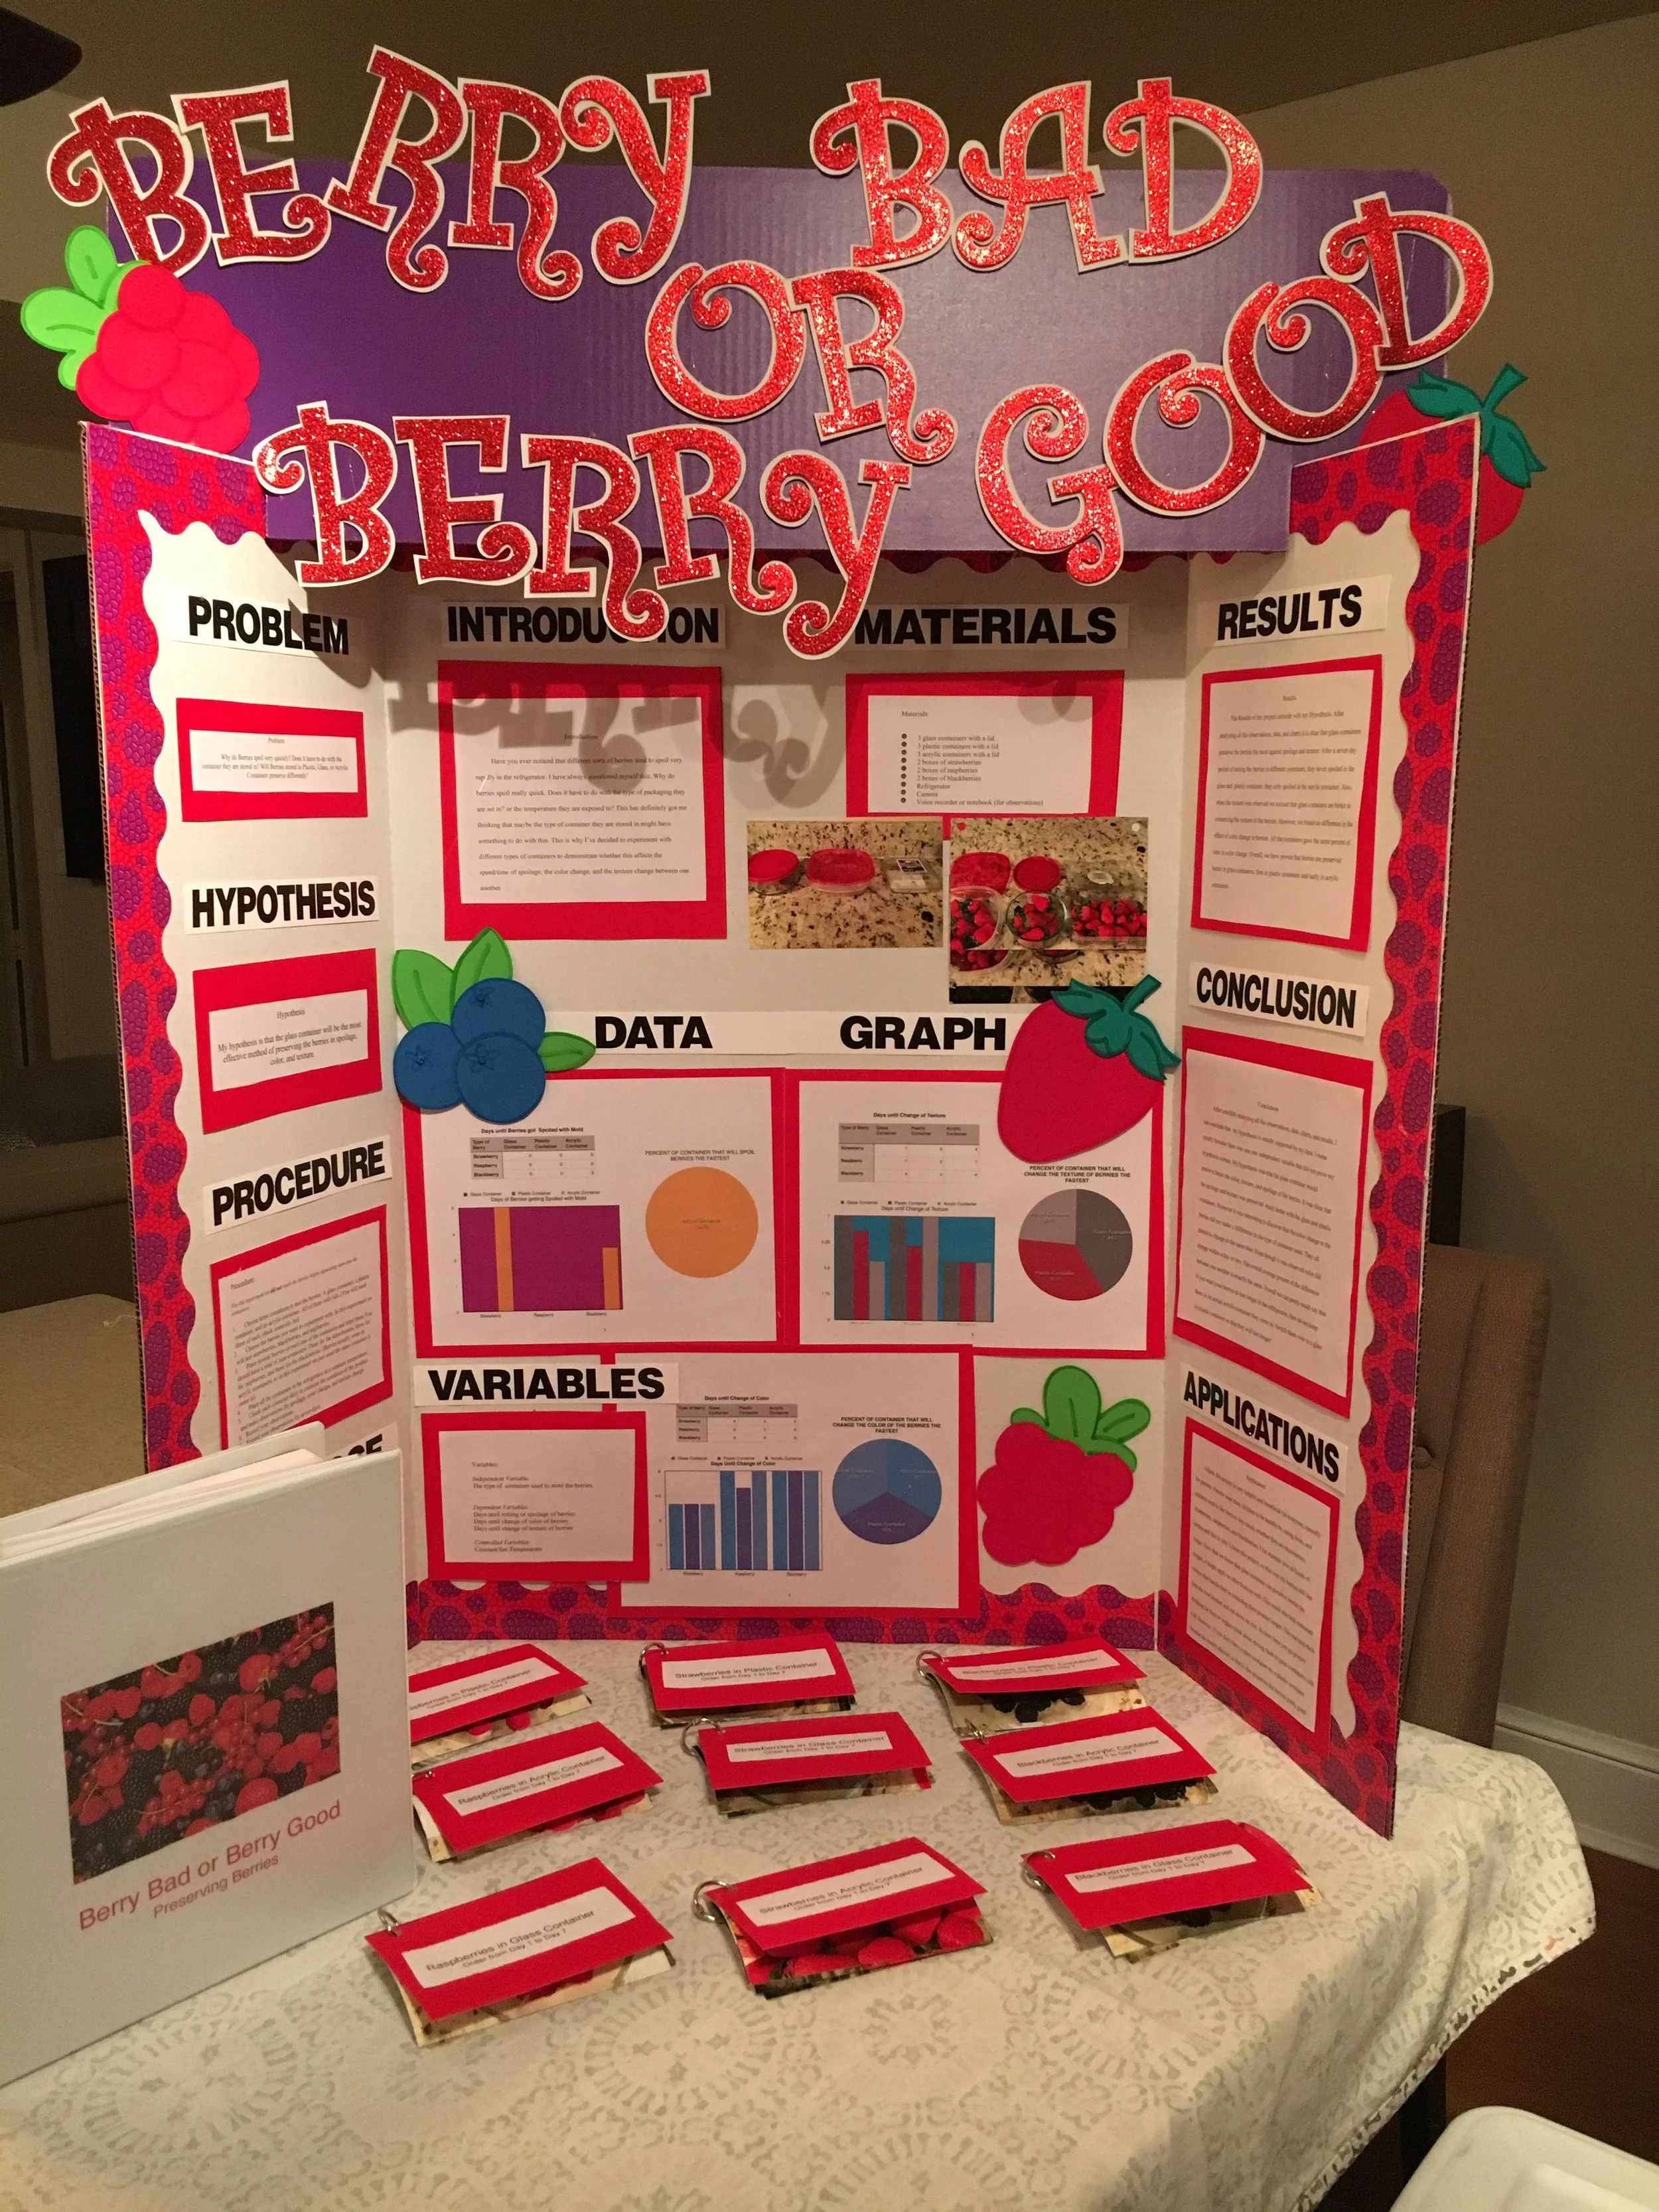
To measure which berries last the longest at room temperature:
Materials:
6 blue berries
6 raspberries
6 Strawberries
Method
the berries were placed on the kitchen table on a plate - 1 plate for each kind of berry.
The berries were covered with cling film to stop them being eaten, and to reduce other potential sources of decay.
The berries were observed for 1 week, with a photo taken daily and counts of rotten berries taken to measure the amount of decay over time.
Do you need a Science experiment idea? Check out Science Buddies
How It Works